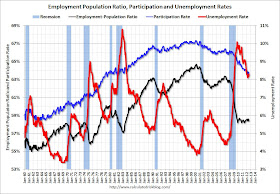
the chart:

the data:
how to find the chart (it's not easy):
- GO TO Bureau of Labor Statistics
- MOUSE OVER Data Bases & Tools
- Under "Customized Tables," CLICK on News Release Tables: link takes you to Historical News Release Tables
- Under "Access to Historical Data Series by Subject: Previous years and months," CLICK wizard to right of "Browse labor force, employment, unemployment, and other data by subject": link takes you to Access to historical data series by subject
- SCROLL DOWN to Employed Persons & CLICK Most Requested Series
- CHECK Civilian Employment-Population Ratio - LNS12300000
- CLICK Retrieve Data et voilà:
- Labor Force Statistics from the Current Population Survey
- CLICK "Include graphs" if you want to include graphs
64.6% of the population employed in 2000
58.4% employed today
update 8/8/2012:
unemployment rate has been decoupled from the employment-population ratio

update update 8/8/2012:
Here is Scott Sumner explaining why level NGDP-targeting is not inflationary. (I don't entirely follow, but am passing this along.)
And here is Boston Federal Reserve president Eric Rosengren endorsing NGDP targeting. Sumner writes: "Two down, 17 to go."

Catherine, if you want only the "final" NYT version of a story, subscribe to the paper edition and read about an economic announcement one day after it is made. Others may prefer more timely information.
ReplyDeleteI don't think that's right --- I'm pretty sure (but correct me if I'm wrong) that earlier versions appeared in the print edition.
ReplyDeleteWhat I'm noting here is a really very large change in content from first to final version, large from a writer's point of view, certainly.
Here's the notice: "A version of this article appeared in print on August 4, 2012, on page A1 of the New York edition with the headline: Hiring Picks Up, But Data Gives No Clear Signal."
ReplyDeleteI don't think the print version is the final version, necessarily.