kitchen table math, the sequel: statistics
Showing posts with label statistics. Show all posts

Sunday, October 19, 2014

Arithmetic for the ages (Ebola v. influenza edition)

Ed and I were chatting about op-eds urging people to forget about Ebola & go get their flu shots, when it occurred to me to wonder how many people actually die of the flu. (Ed had just read an article estimating that with early diagnosis & full supportive care in a Western hospital, the fatality rate for Ebola would be somewhere in the vicinity of 10%.)

Turns out practically nobody dies from the flu:
"Over a period of 30 years, between 1976 and 2006, estimates of flu-associated deaths in the United States range from a low of about 3,000 to a high of about 49,000 people."

Key Facts about Influenza (Flu) & Flu Vaccine
Somebody should check my calculator skills, but using 250,000,000 as the figure for U.S. population I get:

Estimated number of flu fatalities per year: 100 to 1,633
Estimated percent flu fatalities per year: 0.00004% to 0.0007%

I don't know whether the CDC publishes an estimate for how much these numbers were affected by flu vaccine. I'm guessing: not much, seeing as how flu shots aren't particularly effective.

Does anyone know the history of flu shots & the flu shot campaign?

Is there a good reason the entire population is urged to get a flu shot every year?

What am I missing?

For the record, I stopped getting flu shots a few years ago. It's not at all convenient for me to get a flu shot (I used to have to persuade the kids' pediatrician to give me a flu shot, too); the shots hurt; and I always get slightly sick from the shot.

Plus I usually ended up with a wicked case of the flu anyway.

I haven't had the flu since I stopped getting the shot.

Either I'm free-riding on other people's flu shots, or I'm just not getting the flu.

UPDATE: CDC writing lesson & expert raters using holistic scoring rubrics


Friday, October 28, 2011

update update update

Quick note: C., who has left his calculus course for statistics (thank you all for the advice), just told us the calculus teacher is giving his students an essay test. Just to review: this is a calculus class populated by kids who learned next to no precalculus last year. They're in calculus, they don't know any precalculus, and...they're taking an essay test.

Ed said, "You should have stayed in the class. You could have raised your grade."

That was a joke. We both know it's not true. If C. had stayed in the class, he would have done worse on the essay test than he did on the math test, I'll wager.

Must get Allison's Comment about charismatic teachers pulled up front.

C. loves statistics. Loves! First math class he's ever felt that way about.

Sunday, March 13, 2011

Mark Roulo on baseball statistics

re: the 32-parameter value-added model in NYC
One thing I like doing for discussions like this is to try and find a sports analogy. People tend no to get so hung up on non-PC conclusion in sports, but also often care a lot. This can lead to enlightenment.

So ... baseball:

(1) You can get a *VERY* good handle on how valuable a batter is with just two values, which can be combined into one number. You need on-base percentage (OBP) , which is, for every 100 times he comes to the plate, how often does he get on base? And you need slugging percentage (SPG) , which says how many bases he gets each time he has an at-bat. In both cases, more is better. And you can combine them with this: (OBP*3 + SPG)/2 to get a number that works the way most people who follow baseball can understand.

There ARE more sophisticated models, but they don't improve on this one by much. So ... two parameters, both of which are pretty easily understood.

(2) For pitchers it is a bit more complicated, but you can basically track strikeouts, walks and home runs and then put them together to get a single number. Again, one can improve (for starting pitchers, you also care about how "efficient" they are), but basically you'll get the right answer for ranking pitchers with just these three.

I get that teaching is more complicated. But 32 parameters is nuts.

Monday, August 9, 2010

Street-Fighting Mathematics

Freakonomics interview with Sanjay Mahajan:

Q.
I work on the 7th floor. How many additional calories will I expend if, for the next four years, I take the stairs instead of the elevator? – Jordan

A.
Time to estimate! The energy required to raise an object—pretend it is me—to a height is the object’s mass times the earth’s gravitational strength (“g”) times the height.

[snip]

Because the human “engine” is only about 25% efficient (internal-combustion engines are also about 25% efficient), the total energy required is a factor of 4 greater: 48,000 Joules. Each Calorie (with a capital C) is about 4,000 Joules, so the energy required to walk up the stairs is 12 Calories. I could use this value to answer the question, but it would give me just a very large number of Calories, and I would not immediately know whether that number is large or small.

To make this energy more meaningful, I compare it against another relevant energy. A useful estimation fact: a moderate-sized jelly doughnut provides 1 million Joules or about 250 Calories. That would be enough to climb the stairs 20 times. Thus, one jelly doughnut provides enough energy to climb the stairs (every weekday) for a month. Equivalently, climbing the stairs for a month will burn off the Calories from one jelly donut.

Calories with a capital C
The distinction between calories (1 calorie is roughly 4 Joules) and Calories (1 Calorie is roughly 4,000 Joules) is sometimes ignored.


The entire manuscript is available for download at MIT Press, & here's the Amazon link:
Street-Fighting Mathematics: The Art of Educated Guessing and Opportunistic Problem Solving

Street-Fighting Mathematics: The Art of Educated Guessing and Opportunistic Problem Solving

Thursday, June 4, 2009

'an okay teacher with a big mouth'

I feel I know this teacher: I've always loved the teachers with the big mouths! I like quiet teachers, too.... it's just that I have a soft spot in my heart for the brassy ones.

(I have a soft spot in my heart for brassy people in general, come to think of it.)

I'm trying to remember whether palisadesk has given us studies on teacher effectiveness having to do with the teacher as a strong personality -- ? Can't remember. If she's around, I hope she'll weigh in.

In any event, this teacher sounds like a lot of fun.

She was inspired to write a manifesto on taking the bull by the horns after attending a two-day conference on professional learning communities:
From: Ballantine, Sara
Sent: Thursday, January 29, 2009 10:49 PM
To: All Teachers and Staff
Subject: The Problem With Education in America: An Autobiography

Dear Esteemed Colleagues,

I would like to take this opportunity to say, well, to say that we suck. Don’t believe me? Ask Rob, he’ll show you the numbers. Now please take a minute to compose yourselves, grab a tissue, call your mom/spouse/brother/sister/accountant/etc. to wallow in self pity.

Done? Let’s move on.

The question still remains, who is to blame?

No, scratch that. That isn’t the question. The question remains, WHAT ARE WE GOING TO DO ABOUT IT?

I do need to preface this by saying that I have no misgivings about my talent, as well as my shortcomings. I believe it would be safe to say that we, in fact, all have talent, as well as shortcomings. So again, just to be clear, I write this not to determine who is the “suckiest” out of all of us, but rather, as a call to action.

We are all aware that our first semester numbers were pretty dismal to say the least...I don’t feel the need to outline all of the barriers in our way; we are all well aware of the current state of things in our country, our district, and our school.

Thus, I propose that we stop focusing on the things we can’t change, and concentrate on the things we can.

Let’s stop blaming the social demographics of our students, the apathy of parents, the lack of motivation in our students, the skills that they “didn’t come in with,” the middle school teachers, the elementary teachers, the birth control that the parents of our students didn’t take, the fact that we didn’t have any coffee this morning, the union, admin, each other, and start taking responsibility for the job that we were hired to do.

Let’s change our focus from the curriculum that is not available, the money that isn’t there, the challenges imposed by the “block” schedule, and start looking to each other as our greatest resources.

[snip]

The issue is critical, more so than some of us care to admit, and the time to take action is now. Actually, it was yesterday, and even before that, so it must be NOW.

I understand that I am saying things that many of us don’t want to hear, presenting issues that we would rather not confront, and making suggestions that we fear we will not be able to fulfill. I understand that this letter will make me unpopular among some of you, and expect some criticism. And to be frank, I really don’t care. I say that with conviction because this isn’t about me, it’s not about you, it’s about the 900 lives that we are charged with five days a week, 180 days a year, and the job we elected to do.

Some of us will be convening in the staff lounge (in the cafeteria) tomorrow at lunch to begin this dialogue and create and action plan; however, I hope to see ALL of us there. Let’s face it; we don’t have until next week, next month or next year.

So, Esteemed Colleagues, I propose that we do everything we can to make us not just “Better than Good,” but that we do whatever it takes to be more gooder.

No, scratch that. Let’s be great.

Sincerely,

Sara Ballantine

I'm sorry, but I have to say it: DUMP THE BLOCK SCHEDULING. I mean, c'mon. You've got a teacher with a big mouth who's willing to lead the charge, rally the troops, swear off complaining (and gossiping!) in the teacher's lounge -- and you're saddling her with block scheduling?

How about no?

Since I'm not a teacher, I want to add that I haven't put up this post because I think Ms. Ballantine and her colleagues "suck."

I've put it up because I think Ms. Ballantine's approach to herself, her job, and her abilities is pretty close to exemplary -- at least, it is for a certain personality type. Probably the brassy personality type. As she says, she's not concerned about her talent or her shortcomings; she knows she has talent and she knows she has shortcomings. Talent and shortcomings are neither here nor there. What matters is the kids, and that's what she's saying.

"I suck and my data isn't great" can be a highly productive attitude, and I'm in a position to know. That's all.

The Comments are nice, too.

Tuesday, February 3, 2009

voodoo correlations in social neuroscience

I've always been skeptical of big behavioral claims based on brain scan data.

Turns out I was right.

Here's Andrew Gelman (and here, too).

Brain imaging studies under fire (naturenews)

interview: Have the Results of Some Brain Scanning Experiments Been Overstated? (Scientific American)
LEHRER: What is a "voodoo correlation"?

VUL: We use that term as a humorous way to describe mysteriously high correlations produced by complicated statistical methods (which usually were never clearly described in the scientific papers we examined)—and which turn out unfortunately to yield some very misleading results. The specific issue we focus on, which is responsible for a great many mysterious correlations, is something we call “non-independent” testing and measurement of correlations. Basically, this involves inadvertently cherry-picking data and it results in inflated estimates of correlations.

To go into a bit more detail:

An fMRI scan produces lots of data: a 3-D picture of the head, which is divided into many little regions, called voxels. In a high-resolution fMRI scan, there will be hundreds of thousands of these voxels in the 3-D picture.

When researchers want to determine which parts of the brain are correlated with a certain aspect of behavior, they must somehow choose a subset of these thousands of voxels. One tempting strategy is to choose voxels that show a high correlation with this behavior. So far this strategy is fine.

The problem arises when researchers then go on to provide their readers with a quantative measure of the correlation magnitude measured just within the voxels they have pre-selected for having a high correlation. This two-step procedure is circular: it chooses voxels that have a high correlation, and then estimates a high average correlation. This practice inflates the correlation measurement because it selects those voxels that have benefited from chance, as well as any real underlying correlation, pushing up the numbers.
One can see closely analogous phenomena in many areas of life. Suppose we pick out the investment analysts whose stock picks for April 2005 did best for that month. These people will probably tend to have talent going for them, but they will also have had unusual luck (and some finance experts, such as Nassim Taleb, actually say the luck will probably be the bigger element). But even assuming they are more talented than average—as we suspect they would be—if we ask them to predict again, for some later month, we will invariably find that as a group, they cannot duplicate the performance they showed in April. The reason is that next time, luck will help some of them and hurt some of them—whereas in April, they all had luck on their side or they wouldn’t have gotten into the top group. So their average performance in April is an overestimate of their true ability—the performance they can be expected to duplicate on the average month.

It is exactly the same with fMRI data and voxels. If researchers select only highly correlated voxels, they select voxels that "got lucky," as well as having some underlying correlation. So if you take the correlations you used to pick out the voxels as a measure of the true correlation for these voxels, you will get a very misleading overestimate.

This, then, is what we think is at the root of the voodoo correlations: the analysis inadvertently capitalized on chance, resulting in inflated measurements of correlation. The tricky part, which I can’t go into here, was that investigators were actually trying to take account of the fact they were checking so many different brain areas—but their precautions made the problem that I am describing worse, not better!
Of course, now I'm wondering whether there is anything I think I know about brain & behavior that is not based on non-independent analysis.

Tuesday, April 22, 2008

data-driven instruction redux

a comment on data-driven instruction left by Anonymous:

Don't even get me started on this one! I'm in a district that places heavy emphasis on being "data driven". In spite of this emphasis, teachers don't have access to much of the data. They are either lacking hardware, privileges, or timeliness to make it accessible and relevant. This is all before we get to the training issues.

Worse, let's say your data tells you that Johnny is in the sixth grade and can't add, there is no system in place to do anything about it. Sure, you can try to get him to stay late for help or you can differentiate in class (at the expense of what he's supposed to be current with). But, there is no way (especially with 50% of your kids in this condition) to get Johnny remediated.

As long as curriculum fills every inch of available space, teachers aren't going to use objective data to replace subjective data when neither can be used as a force for change.


Interesting.

Tell us more if you get a chance.

And thanks!


more fun with numbers
data-driven instruction redux
data-driven loops & noise

Monday, April 21, 2008

more fun with numbers

In our non-degree professional development programs at Harvard University, I have taken to routinely asking the assembled administrators and teachers how many of them have taken a basic course on educational measurement. In an audience of 50 to 100 participants, the usual count is two or three. These people are usually “ringers”—they are typically assistant superintendents for measurement and evaluation. That is, they run the testing operation in their school systems. Now, imagine what the state of health care would be if practicing physicians didn’t know how to read EKGs, EEGs or chest x-rays, didn’t know how to interpret a basic blood analyses, or didn’t know anything about the test-retest reliability of these simple diagnostic measures. Imagine what it would be like if your basic family practitioner in a health maintenance organization didn’t know how to interpret a piece of current medical research questioning the validity of the standard test for colo-rectal cancer. Imagine what it would be like to be a practitioner in a health care organization in which every piece of evidence required for patient care came from a standard test of morbidity and mortality administered once a year in the organization. The organization you are imagining is a school system.

Leadership as the Practice of Improvement (pdf fie)
Richard F. Elmore

This probably accounts for the existence of books with titles like: Getting Excited about Data Second Edition: Combining People, Passion, and Proof to Maximize Student Achievement by Edie L. Holcomb.

This text is actually written in language that educators can understand, even if they aren't especially data-savy. The guidelines for incorporating data for school improvement are actually practical and easy to replicate. A great guide for joining the data-driven school improvement movement!
5 stars

In theory, my district is using data to inform instruction. We have a data warehouse.

Thus far, however, the data is apparently showing that all learning problems in the gen-ed population can be attributed to student failure to Seek Extra Help. Either that, or Weak Inferential Thinking.

Which is pretty much what all learning problems were attributed to before we had a data warehouse as far as I know.


more fun with numbers
data-driven instruction redux
data-driven loops & noise

Tuesday, April 8, 2008

4 for 4


I've decided to quit while I'm ahead.

Monty Hall redux

Monty Hall redux

The Monty Hall Problem has struck again, and this time it’s not merely embarrassing mathematicians. If the calculations of a Yale economist are correct, there’s a sneaky logical fallacy in some of the most famous experiments in psychology.

The economist, M. Keith Chen, has challenged research into cognitive dissonance, including the 1956 experiment that first identified a remarkable ability of people to rationalize their choices.

[snip]

For half a century, experimenters have been using what’s called the free-choice paradigm to test our tendency to rationalize decisions. This tendency has been reported hundreds of times and detected even in animals.

And Behind Door Number 1, A Fatal Flaw
John Tierney
NY Times April 8, 2008


death by data

bonus points: After you play the Monty Hall game online you can fire up the National Geographic jigsaw generator.

And don't forget Glumbert.


low birth weight & Monty Hall
more on false positives
Monty Hall part 2
Monty Hall in Curious Incident
Doug Sundseth on Monty Hall problem
probability question from Saxon Math

Wednesday, March 26, 2008

collect and correct

The terrific Huffenglish blog, which I think Liz Ditz may have introduced me to, pointed me to research on homework.

Turns out the question of whether collecting and correcting homework produces more learning than simply assigning homework & not looking at it has been asked and answered.

Collect-and-correct wins hands down.


source:
Classroom Instruction that Works: Research-Based Strategies for Increasing Student Achievement by Robert J. Marzano, Debra J. Pickering, & Jane E. Pollock


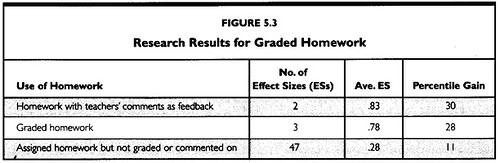
The average effect size for assigned-but-not-graded-or-commented-upon homework is .28; average effect size for graded homework is .78; average effect size for homework with teacher's comments or feedback is .83.

.83 is a very large effect size:

Effect size = (mean of experimental group - mean of control group)/standard deviation Generally, the larger the effect size, the greater is the impact of an intervention. Jacob Cohen has written the most on this topic. In his well-known book he suggested, a little ambiguously, that a correlation of 0.5 is large, 0.3 is moderate, and 0.1 is small (Cohen, 1988). The usual interpretation of this statement is that anything greater than 0.5 is large, 0.5-0.3 is moderate, 0.3-0.1 is small, and anything smaller than 0.1 is trivial. There is a good site that describes all this that is worth a visit for those really interested.
source:
Bandolier


And, from Robert Coe, of The CEM Center:

Interpreting Effect Sizes

Provided our data have the kind of distribution shown in Figure 1 (a ‘Normal’ distribution), we can readily interpret Effect Sizes in terms of the amount of overlap between the two groups.

For example, an effect size of 0.8 means that the score of the average person in the experimental group exceeds the scores of 79% of the control group. If the two groups had been classes of 25, the average person in the ‘afternoon’ group (ie the one who would have been ranked 13th in the group) would have scored about the same as the 6th highest person in the ‘morning’ group. Visualising these two individuals can give quite a graphic interpretation of the difference between the two effects.

[snip]

Another way to interpret effect sizes is to compare them to the effect sizes of differences that are familiar. For example, an effect size of 0.2 corresponds to the difference between the heights of 15 year old and 16 year old girls in the US. A 0.5 effect size corresponds to the difference between the heights of 14 year old and 18 year old girls. An effect size of 0.8 equates to the difference between the heights of 13 year old and 18 year old girls.

What is an effect size? A brief introduction
Robert Coe


As far as I can tell, collecting and correcting (which would cost nothing to implement in a school district not collecting and correcting) is a far more powerful force for student achievement than small class size (which costs a bundle) or SMART Boards ($4000 a pop).

So --- bonne idée!


source:
Class Size: Counting Students Can Help (pdf file)


Robert Marzano's book, which is published by the ASCD, is extremely well-known in the field of education.


HyperStat: Measuring Effect Size
The Effective Use of Effect Size Indices in Institutional Research by Christi Carson (pdf file)
Food for Thought by Howard S. Bloom (pdf file)
Statistical Power Analysis for the Behavioral Science by Jacob Cohen
Evidence-Based Education
What is an effect size? by Robert Coe

The Homework on Homework, Part One

Wednesday, January 2, 2008

The future of education

This post summarizes a more detailed series of posts at my blog – go here to see the first of five on this subject.

It’s the start of a new year, a time for considering the future and making plans accordingly. For those of us who work with the public education system in one way or another, it might be helpful to reflect on how the system might change over the next several years so we’re ready for it.

Consider how the following major trends are going to shape public education in the future:

More kids, different kids
  • According to NCES, “school enrollment is projected to set new records every year from 2006 until at least 2014, the last year for which NCES has projected school enrollment.” We’re currently at 55.1 million, and will creep up to a projected 56.7 million in 2014.
  • In the year 2000, whites made up 69.9% of the total US population, with all other groups comprising 30.1%. We are on a track towards an even split by the year 2050, with whites comprising 50.1% of the population, and all other groups making up 49.9% (see here). Due to fertility rates, diversification is happening more quickly in the schools: by 2020 approximately 40% of school-aged children will be from minority groups, and by 2025 we can expect to see that the child population will comprise 15.8% blacks, 23.6% Hispanics, 1.1% American Indian/Native Alaskans, 6.9% Asian/Pacific Islanders, and 52.6% whites.
  • In addition to racial/ethnic diversity, it is reasonable to assume that the special education population will continue to grow, given that it has seen steady growth from 8.3% in 1976/77 to today’s 13.7% (see here).

NCLB
  • While the particulars of No Child Left Behind may change somewhat during the reauthorization process, the fundamental concepts on which it is built – equity (educating every child) and accountability – are here to stay for the foreseeable future. Advancing these two concepts in tandem, by requiring that achievement reports include disaggregated data (so we can track the performance of each subgroup), means that we can’t mask or hide our progress.
  • It’s a major change because, while we’ve always talked about the importance of educating every child, we haven’t really done it. The gap between different student groups has been with us for decades, and has not changed significantly for quite some time. Another indication of our lip service in this area is the difference in dropout rates by race/ethnicity, with recent calculations indicating that 75% of white students graduate high school, but only 50% of African-American and 53% of Hispanic students do so.

School Finance
  • Average per-student expenditures have increased dramatically in the past 40 years, from $3400 in 1965 to $8745 in 2001 (in constant dollars). This almost certainly cannot continue.
  • In the short term, revenues will be pressed by the subprime mortgage crisis: state and local education funding is fueled in part by property taxes, and some experts predict a 15% peak-to-trough adjustment in home prices in the near term. Twenty states are already having to revise their 2008 budgets as a result.
  • In the long term, we’re about to see a record number of people moving into retirement age: in 2000, we had 35.1 million people ages 65+, or 12.4% of the population; in 2050, we’ll have 86.7 million in that age group, or 20.6% of the population. These are people who were formerly paying into the system (income taxes), and are now going to be pulling out (in services). And this powerful voting group is less likely to support education funding.
  • The rise in retirement will fuel an increase in the costs of Medicaid to the states, which shoulder approximately 43% of the cost of this program. Medicaid currently accounts for 22% of state spending (up from 8% in 1985), and recently surpassed K-12 education as the most expensive item on state ledgers. And it’s growing at 6% annually, twice the rate of inflation.
  • While revenues are about to be pressed, expenditures are set to grow significantly. Education is a manpower-intensive business, with 6 million employees currently in the system. First, consider that states have not set aside enough money to cover the retirement benefits of employees (current retirement programs are underfunded by $731 billion). Then consider the rising cost of health insurance, coupled by the fact that many teachers receive full coverage not only for themselves, but for spouses and children as well. As one administrator said, the rising cost of health insurance “is the single most important issue facing districts nationwide."

What does all this mean? It means we’re going to have more kids than we’ve ever had before, and that the population will increasingly be made up of the kids we haven’t done a great job with in the past. We’re making a commitment to teach them all, and have a system in place to see whether we’re actually doing that, so it’s going to be a lot tougher to gloss over any shortcomings. And this is all happening at a time when budgets will either stagnate or even shrink due to major economic forces.

Thoughts?

Wednesday, June 20, 2007

how to decide

So I was arguing with Ed about CO2 and global warming.

When he flew back from Brussels not long ago, he sat beside some international science type who told him there is a near-absolute consensus that CO2 is causing global warming, and "the only interesting question" is what to do about it. The economists are figuring it out.

Ed reported this to me as settled truth. (Settled enough.)

Naturally I took it amiss.

I don't happen to have the first clue whether CO2 is causing global warming. Normally I assume CO2 is causing global warming because of the aforementioned near-absolute consensus.

However, if you made me bet money on CO2 being the cause of global warming, I wouldn't bet the ranch.

The reason I wouldn't bet the ranch is the aforementioned near-absolute consensus. My rule: in cases where everyone believes X, and where, more importantly, everyone fervently believes X, it's best to take a step back.

I don't know why I think this, exactly. Emotion per se isn't the problem. I believe, with Damasio & c., that emotion and reason are allied.

If you want to know why I have this decision rule or what role other people's emotions plays in it, you'll have to ask my cognitive unconscious. All I can say is that when emotion has led to dissenters being called "deniers" and the like, I assume we've left Damasioland.

Ed took that amiss.

I kept trying to say, "It's a writer thing," (which it is, for me at least) but that got me nowhere until I invoked Bayesian reasoning. Citing Bayes sounded good and it worked: "worked" meaning Ed decided to stop seeing my position as "they're in it for the (grant) money" and to start seeing my position as the logical result of a nonfiction writer applying a semi-conscious Bayesian heuristic to the problem.

So this morning I picked up Daniel Willingham's collection of classic articles in cognitive science, and found this: The benefit of additional opinions by Ilan Yaniv.

Lots of fun, and directly apropos:

  • in a study of inflation forecasts, the aggregate prediction was "more accurate than most ...individual forecasts, though not as good as the best ones. The best forecasts, however, could not be identified before the true value became known."
  • you only need 3 to 6 extra opinions to gain the full value of aggregated opinions
  • Condorcet's jury theorem, when applied to "categorical, binary judgments," is the exception that proves the rule - with binary judgments, the more experts the better
  • experts whose opinions you seek need to be independent to give you the benefit of opinion aggregation [score one for me]
  • otoh, "gains of appreciable size can be observed even when there are low or moderate positive correlations between the judgments of the experts." [one for Ed]
  • people are biased in favor of their own opinions (roughly: 70% favoring own opinion, 30% favoring advisor's opinion)
  • people are biased against dissenters [no kidding]
  • being biased against dissenters makes sense when there is a range of opinion on a subject ("fat tails")
  • I assume, though Yaniv does not say so, that the opposite is true: being biased against dissenters does not make sense when there is a near-absolute consensus

Which would mean that my "writer's rule" is a good one. In cases of near-absolute consensus buttressed by high emotion it's best to take a step back.

Naturally I apply this principle to constructivism (though not to instructivism - no, never!)

Joking aside, my Bayesian rating scale tells me that when a Stanford University School of Education professor publicly - and sympathetically - characterizes constructivism as a ruling ideology, I have just been told everything I need to know about whether constructivism is a correct model of the world.

...........................


I have to learn grammar.

I have no idea whether "Joking aside, my Bayesian rating scale..." is or is not grammatical.

Have I just said that my Bayesian rating scale has set joking aside?

I don't know.

I'm going to have to learn how to diagram a sentence, too.


Ilan Yaniv homepage

Monday, June 4, 2007

mother lode

worksheets: arithmetic through calculus

yowza!

Now I can spend the rest of the night downloading stuff onto my desktop instead of revising my chapter.

two birds, one stone

Tuesday, May 29, 2007

algebra 2 & trigonometry recommendations

Does anyone have algebra 2 & trigonometry recommendations?

Any thoughts on Dad's Trigonometry?

Or on College Mathematics?

Another question.

Foerster's Algebra 1 is fantastic. (I think someone from ktm-1 sent that book to me - right?? ... yup, I thought so) When I was struggling to teach myself & Christopher function notation in 24 hours, Foerster's was the book for the job. I Xeroxed pages for my neighbor to use, too. Wonderful.

It has rave reviews on Amazon, and Mathematically Correct likes it, too, as does Greta F.

Here's a review from one of his students:


A former student of Mr. Foerster's, November 2, 2001 Until I met Mr. Foerster, I thought I desperately hated math. I scored well in it, yet I just hated the whole subject.

Mr. Foerster is truly an inspiring man; the whole high school was in awe of him. His courses were reputed to be extremely tough. But the hallway gossip was soon dispelled. Although Algebra isn't always "easy", I was quite surprised and delighted to discover that Mr. Foerster's classes - and especially his textbooks - were extremely user-friendly! Mr. Foerster writes clearly, and is able to address Algebra from the beginning, rather than talking several levels over students' heads. His kindness, humor, and gentle personality show through in the books. Wow! Math is fun after all!

I am now homeschooling my three kids, and Foerster's books are the texts of choice in this family.


So... is his second book, Algebra and Trigonometry, also great?

Does anyone know?

Last but not least, I notice he has a calculus text, too, which apparently is used in AP calculus classes.... and I spy a notation from teacher-2-teacher in my textbook file: "a great reform book."

hmmmm....

Sample chapter & material from instructor's manual here.


Prentice Hall Classics (math & social studies)
Prentice Hall Math Classics