kitchen table math, the sequel: decline at the top
Showing posts with label decline at the top. Show all posts

Wednesday, February 18, 2015

Speaking of millennials

Which I was ....

Education Week reports that a new set of dismal international comparisons--of millenials, this time--is coming out next week. I can't tell whether the test is good, but, then again, I'd just as soon U.S. high school graduates not score lower than high school graduates in every country except France no matter how possibly lousy the test.

[pause]

Yikes.

Here are 3 sample math questions.

Down the rabbit hole:
It's far from the first study to suggest American students are falling behind their international peers. But the analysis of U.S. millennials—those born after 1980, ages 16 to 34 during the study—specifically highlights that the skills gap goes beyond young people who are typically seen as more "at-risk," like immigrants and high school dropouts.

[snip]

The ETS study, to be released this week, compares millennials in 22 industrialized countries, including the United States, who took part in the Program for the International Assessment of Adult Competencies, or PIAAC, in 2012, the last time it was given. The Organization for Economic Cooperation and Development, which runs the school-based Program for International Student Assessment, also runs the PIAAC, which is given directly to adults in their homes. Unlike the PISA, which measures academic content skills, the PIAAC measures practical, career-oriented literacy and numeracy skills, and, as of 2012, "problem-solving in technology-rich environments."

[snip]

Across the board, young Americans fared poorly compared to those in the other countries studied. They tied for last, with Italy and Spain, in math skills. In problem-solving, they again performed at the bottom of the pack, with Ireland, Poland, and the Slovak Republic. U.S. millennials also had lower literacy scores than peers in 15 out of 22 countries, tied with a few, and outperformed only peers in Italy and Spain.

[snip]

. . . the skills gaps persisted among students who are least likely to be considered academically at risk. Those who performed in the top 10 percent of all Americans in their age group still performed worse than the top performers in 15 other countries, including Germany and the Republic of Korea.

While a higher proportion of U.S. millennials versus those in other countries had earned a college degree, those with a four-year degree in the United States still showed lower math skills than those with college degrees in any country studied but Poland and Spain.* Moreover, the percentages of Americans who demonstrated the lowest-level math skills increased from 2003 to 2012, regardless of what level of education they had achieved.

[snip]

Even those with a master's or doctoral degree demonstrated lower numeracy skills than their counterparts in all but a few countries. The average U.S. math score for millennials with a postbaccalaureate degree, 308, was not only below the average for countries studied who are in the Organization for Economic Cooperation and Development, but was below the average score for young adults with just a bachelor's degree in several countries, and near the score for top-performing students with less than a bachelor's degree in a few countries.

[snip]

American millennials with a high school diploma or less performed lower than those with a secondary credential in every country but France.

[snip]

. . . in the United States, native-born millennials showed a greater decline in skills from the 2003 to 2012 cohorts than did their immigrant peers.

[snip]

Racial and ethnic performance gaps continued, with 12 percent of white and Asian young adults in America showing advanced levels of math skill, versus only 3 percent of Hispanic and 1 percent of black millennials. Yet on average, OECD countries had about 15 percent of all millennials performing at an advanced level, and white and Asian students in the United States performed below their counterparts in most other countries studied.

From the department of unintentional irony:
While a higher proportion of U.S. millennials versus those in other countries had earned a college degree, those with a four-year degree in the United States still showed lower math skills than those with college degrees in any country studied but Poland and Spain.
If a higher proportion of U.S. millennials finish college, then you would expect college-educated U.S. millennials as a group to have a lower average math score than college-educated millennials elsewhere. [Copy edit courtesy of Glen]

I wonder how the numeracy skills of U.S. education reporters stack up compared to those of education reporters in France and Spain.
.

Saturday, January 14, 2012

deathless

We point out simply that not only do U.S. students on average perform better internationally than reported in a myriad of policy papers, but as Boe and Shin demonstrate, the majority of U.S. students (white students) actually rank near the very top on international tests.
Into the Eye of the Storm
October 2007
B. Lindsay Lowell Georgetown University
Hal Salzman The Urban Institute
Right.

That's why my high-IQ, culturally-advantaged, non-hyperactive, W-H-I-T-E, rising-5th grade son placed into the second-semester 3rd grade textbook in Singapore Math back when he was age 9. (placement test here).

In the real world, a gap that big by age 9 does not get smaller.

It gets bigger.


non-poor students doing fine in Princeton

Tuesday, December 27, 2011

non-poor students doing fine in Princeton

From the Princeton Alumni Weekly, an interview with Earl Kim, Class of '93, now superintendent of Montgomery Township Schools:
When, exactly, did public education become a blood sport? Granted, there were vicious battles over busing in the 1970s. But now the whole American system of public education, which once made us so proud, seems to have become suspect. Perhaps it’s all those reports that show how far our students now lag behind their peers in places like Finland and Singapore — though Kim points out that once you adjust for poverty, we are still doing fine...
Affluent suburban schools, in my experience, don't have much truck with data. My own affluent suburban school district, for instance, grades itself on a strictly pass-fail basis. Percent passing the state tests, percent failing the state tests. Percent passing AP exams, percent failing AP exams. We have many more passes than fails, and we are doing fine.

The question is: what does "doing fine" actually mean in the larger scheme of things?

The Global Report Card, which ranks US schools against schools in 25 developed countries, puts Montgomery Township schools at the 76th percentile in math, 83rd in reading.

As to Finland and Singapore, here are the numbers for Montgomery Township:


Mind you, these aren't apples-to-apples comparisons. Montgomery Township is affluent and well-educated; assuming I understand the website, affluent children with well-educated parents in Montgomery Township are not being compared to affluent children with well-educated parents in Finland, Singapore, and Canada. Affluent children with well-educated parents in Montgomery Township are being compared to all students in Finland, Singapore, and Canada.

If Montgomery Township students are in, say, the 90th percentile of US students in math (they may be higher), is it "fine" for them to be in the 56th percentile in math in Singapore?

Maybe so.

Princeton trivia: Ben Bernanke served on the Montgomery Township Board of Education.

Thursday, December 1, 2011

The Day of Reckoning, brought to us from India

Together, the rise of Reform Math, the reduction in ability-based grouping and AP classes, the demise of the close reading and the analytical essay (see also this), and the growing rarity of instruction in the finer points of English grammar and sentence construction, have caused current and future American high school graduates to be decreasingly prepared for college. As more and more American college students display skills in math, writing, and reading comprehension that are way below expectations (ending up, even in some of the more selective colleges, in remedial math and writing classes), college admissions committees are increasingly looking abroad.

While much of the news about overseas applicants centers on China, with its thousands of Ivy League-aspiring applicants and their glossy, high-production value applications (and the growing suspicion that a fair amount of cheating is involved), it's India, I predict, that will bring to the American K12 education system the day of reckoning that we so desperately need it to have. First, unlike their Chinese counterparts, college applicants from India face no linguistic barriers; many speak and write a much more eloquent English than American (and even British) students do. Second, there are apparently tons of extremely well-qualified Indian applicants pinning their hopes on America's top colleges.

Indeed, as an October New York Times article inadvertently suggests, the Day of Reckoning may be close at hand:
Moulshri Mohan was an excellent student at one of the top private high schools in New Delhi. When she applied to colleges, she received scholarship offers of $20,000 from Dartmouth and $15,000 from Smith. Her pile of acceptance letters would have made any ambitious teenager smile: Cornell, Bryn Mawr, Duke, Wesleyan, Barnard and the University of Virginia.

But because of her 93.5 percent cumulative score on her final high school examinations, which are the sole criteria for admission to most colleges here, Ms. Mohan was rejected by the top colleges at Delhi University, better known as D.U., her family’s first choice and one of India’s top schools.
...

Ms. Mohan, 18, is now one of a surging number of Indian students attending American colleges and universities, as competition in India has grown formidable, even for the best students. With about half of India’s 1.2 billion people under the age of 25, and with the ranks of the middle class swelling, the country’s handful of highly selective universities are overwhelmed.
True, another reason--indeed, the only reason mentioned in the Times article--why American recruiters are seizing on this opportunity is because so many of the crème de la crème of overseas students are wealthy enough to pay full tuition, unlike many of their American counterparts. But it also helps that the K12 schools they attend aren't using Reform Math, aren't renouncing ability-based grouping, and aren't failing to provide college prep classes that are truly college preparatory. Indeed, if it were primarily her parents' pocket books that make Moulshri Mohan so attractive to Dartmouth and Smith, why are they offering her so many thousands of dollars of scholarship money?

So here are my dire predictions. In the next ten years, as the effects of Reform Math continue to percolate up the American school system, and as the number of highly qualified Indian students continues to outpace the numbers of spots at the best Indian universities, there will be a the growing displacement of American students by Indian students. Only then will a large enough proportion of the Powers that Be start realizing how urgent it is to enact actual education reform--reform, that is, that reverses the century's-long tide that has pushed our K12 schools further and further away from what's happening in the most successful school systems overseas.

(Cross-posted at Out In Left Field)

Thursday, July 7, 2011

Mike Petrilli on suburban parents

When I think about my aspirations for my boys (ages 3 and 1), I take as a given that they will do fine academically. Maybe that’s naive, but I just assume that they will end up going to a good college, find interesting work, and so forth. What I want for them is to enjoy the ride along the way: Make close friends, have plenty of time for play, learn to be part of a team (athletic or otherwise), tap into their artistic nature, spend as much time outdoors as possible. These inclinations led my wife and I to pick a Waldorf preschool for their early years. We’re not sure we’ll stick with such an “alternative” approach over the long term. But I surely don’t want my boys anywhere near a “testing factory.”

[snip]

But with a degree of affluence comes a degree of luxury. Confident that their kids will do OK academically and vocationally, I bet that many upper-middle class parents want to reach for something more: Emotional health, spiritual fulfillment, a sense of social responsibility. And thus the frills that Lewis derides (like all manner of extra-curricular activities) become quite important. And as for the test scores–well, who cares if they are really, really high or just really high?

Understanding upper-middle-class parents
Good enough is good enough.

Mike Petrilli is an Executive Editor of Education Next and an Executive Vice President of the Fordham Foundation.

and see:
decline at the top
nominally high-performing schools

Wednesday, March 2, 2011

decline at the top - the best students fared worst

Back in 1977, having watched SAT scores fall for 15 years, the College Board, which developed and administers the SAT, engaged a panel to try to identify the underlying causes of the decline. A first hypothesis to be checked was whether the test had somehow become more demanding. But, no, to the contrary, indications were that scoring had become more lenient. A second prominent hypothesis was that the decline was due to changes in the demographics of the test takers. Analyses shows this hypothesis to be largely correct, but only for a brief while. Over the early 1960s, changes in the composition of the tested population accounted for as much as three-quarters of the test score decline—and, no wonder, for during this period the number of students taking the SAT tripled. Over the 1970s, however, though the test-taking population stabilized, the scores did not. Instead, the decline continued, even steeper than before, while the extent to which it could be ascribed to demographic shifts shrank to 30 percent at most. Furthermore, the scores that dropped most were those of the strongest students, the students in the top 10 percent of their class; the scores of students toward the bottom of the distribution held steady or even increased.

Advancing Our Students' Language and Literacy: The Challenge of Complex Texts
by Marilyn Jager Adams
American Educator | Winter 2010 - 2011

Wednesday, December 22, 2010

if you can't do it, you don't understand it

cross-posted at the Irvington Parents Forum:
Reviewing his son’s grade-school homework in the early 2000s diverted W. Stephen Wilson from his research in algebraic topology to question basic math education. At two well-regarded private schools, Wilson’s son had encountered the most widely used elementary math curricula, Investigations and Everyday Mathematics. Both encourage the use of calculators for multiplication and division, in line with a 1989 report from the National Council of Teachers of Mathematics that downplayed teaching arithmetic with pencil and paper. “What the schools were doing with math was beyond my imagination,” Wilson says. “I knew that my kid’s third-grade math wasn’t going to prepare him for college.”

A professor of mathematics in the Krieger School, Wilson teaches calculus to undergraduates. In 2006, he decided to conduct an experiment with his Johns Hopkins students. His Calculus I for the Biological and Social Sciences class that year bore close resemblance to the 1989 class. Their scores on the SAT math exam were nearly identical, and the two groups contained the same percentage of freshmen. Curious to see how they’d compare on the same exam, he gave the 2006 students the same 77-point final that he’d given the 1989 class. The results, he believes, confirmed his hunch that students were coming out of K–12 schooling less prepared for college math. When he compared scores by the grading scale in use in 1989, 27 percent of the 1989 students received As on the exam and 37 percent scored Bs. Only 6 percent of his 2006 students would have received As, 26 percent Bs.

[snip]

As another experiment, Wilson gave a short test of basic math skills at the start of his Calculus III class in 2007. The results predicted how students later fared on the final exam. Those who could use pencil and paper to do basic multiplication and long division at the beginning of the semester scored better on the final Calc III material. His most startling finding was that 33 out of 236 advanced students didn’t even know how to begin a long division problem.

Wilson says he wouldn’t be so against calculator use if teachers still taught multiplication and division by hand as well, regardless of the fact that few will ever do math that way as adults. “The theory that people should only learn what they are going to use as adults doesn’t make a lot of sense,” he explains. “If you take that to the extreme, there wouldn’t be much left to K–12 education. If someone is going to fly an airplane when they grow up, should we skip all the intermediate steps and just teach them how to fly an airplane when they are 10?”

[snip]

In 2006 he served as senior adviser for mathematics in the U.S. Department of Education, where he helped form the National Mathematics Advisory Panel. Since his return to his Hopkins classes in 2007, Wilson has continued to review K–12 curricula for various states.

Wilson has found that the brightest students work around what he calls their “unnecessary handicap.” In his study of 2007 Calculus III students, for example, the correlation between being “division clueless” and scoring poorly on the final exam wasn’t as strong as he would have guessed; some of those students did just fine. But that seemed true only for the minority. When he followed up on the class two years later in 2009, one-third of the “division-clueless” students were on academic probation.

Wilson doesn’t like the long-term implications of a new generation of engineers and scientists who can’t divide or don’t know their multiplication tables. He compares it to having car mechanics who only know how to fix automatic transmissions. “You might use a calculator if you’re an engineer, but you need to know what it does. If you need mathematics in your career, then it is probably a good idea to really understand it,” he says. “You don’t understand it if you can’t do it.”

Back to Basics for the “division clueless”
By Lisa Watts
December 6, 2010
Johns Hopkins Magazine

Friday, September 4, 2009

Can we clone her?

Excerpts from an article entitled "Head of the Class" by long-time science teacher, principal and college professor Louse Butler, author of Beating the Bell Curve, in the August 2009 Mensa Bulletin (emphasis--and any typos--mine):

On entering education:
The politics of education was a disappointment and a shock to me. Our boards of education are purely political entities, state boards of education even more so. The two largest teachers groups, the National Education Association and the American Federation of Teachers, are nothing but political organizations. Throw in the colleges of education [which] are populated by frighteningly political professors, and you have lots of people in power with plenty of axes to grind, many of which bear only tangentially on education. Our schools should be places where barriers are removed and doors of opportunity are opened through the common denominator of knowledge, but they should never be tools of social engineering.

On science education in the US:
There are too many people in education who think that science and math are elite subjects. They think they are too difficult for the average student and therefore are not to be emphasized in curriculum or in practice. These people are wrong. Science and math not only provide essential information, but they give us a logical and critical way of thinking. Science is a process of thought as much as it is a body of knowledge Science and math should be part of all instruction, enhance all instruction, and clarify all instruction. Sadly, the same people who want to reserve science for the few are the same people who don't want us to teach phonetic reading, civics, or geography.

Right. Science and math, as disciplines and over time, promote the development of critical thinking. Critical thinking cannot be taught in a vacuum.

And essential information to boot!

Where would she like science curriculum to go?
I can tell you where [it] shouldn't go. The consolidation of science curriculum into general science instead of its component disciplines is nothing more than a dilution of scientific knowledge to accommodate the shortage of qualified science teachers. We saw the same think happen when "social studies" was substituted for the real disciplines of history, geography, civics, and economics [ed: right, Catherine?]. And look what a mess that has turned out to be!

On the state of education in the US in general:
The drop out rate of first-year teachers is ridiculously high. The children don't seem to want to learn, and their behavior runs from difficult to outrageous. Our schools have, frankly, fed their students a load of manure. At the very least, the first-year teacher feels that their training doesn't reflect the real world. They become disillusioned, frustrated, and angry with themselves and the system and they quit. It is a terrible waste of time and talent. Show me a teacher who went into education just because they love children, and I'll show you a person who will be found bound, gagged, and abandoned in her closet by a group of third graders some time in mid-September. What you have to love is knowledge.

Bingo.
I see school systems that seem to have decided their first and only function is educating their students in a rigorous and challenging curriculum, and those systems are beacons of light in a dark night. It is interesting that these positive changes seem to be all in small and isolated spots. There aren't any "big course" corrections coming out of our colleges of education.

On why education in the US has slipped:
Part of the problem is teacher preparation. Another problem is our decision to excuse poor performance instead of correcting it. Starting in the 1970s, there was a "feel good" movement that pushed for a mea culpa for the world's ills by giving students a pass on anything that might make them feel challenged. What we got was a generation that was very comfortable with failure. We are having a hard time recovering from that, because the students who grew up with that are now teaching the next generation of teachers.

That's the most concise synopsis of the main problem I've ever seen.

On what the next generation of children can expect:
If we are going to compete with students in the emerging nations, especially in Asia, we are going to have to stop using schools for social experimentation and return to using them for education. We are going to have to accept that students must be reading fluently by third grade. They must be ready for algebra in eighth grade.

On how to reach students in mixed ability classrooms:
Many theorists in the educational community will be shocked to hear me say that I reached all of my students by teaching to the top of the class. You put in plenty of safety nets to catch the students who need extra help, but the forward direction of the class should always be the top. By doing that, you make sure you reach the students who will return the biggest bang for the buck, and you make success the standard. The key is to assume that most of your students can achieve the same standard. You help everyone, but hold no one back. . . Not that my class was a democracy. I was in charge, and any one who doesn't think that children need a leader hasn't tried to organize so much as a rock fight.

Wow. If we had 100,000 Louise Butlers, just imagine where US education would be!

Wednesday, March 18, 2009

Schmidt on the elite kids

This system of ours has failed the elite kids, too. This is a little known fact because it wasn’t emphasized very much, but in the early TIMSS study there was a high school specialist exam for those kids that were the AP physics kids and those that were the AP calculus kids. Those kids were last among their counterparts in the rest of the world. That is, if you took the elite track in the French system that was leading to math and science, these [American] kids were at the bottom. So we’re failing those kids just as much as we’re failing the kids on the other spectrum.

William Schmidt, Michigan State University
U.S. TIMSS National Research Coordinator
Baltimore Curriculum Project/Leading Minds

Monday, February 23, 2009

cranberry on wealthy schools & the sorting machine

The tracking and sorting process goes on, while the administration denies its long-term effects on the students. Placement into high school courses is decided on the basis of teacher recommendations, not grades, strangely enough.

In our affluent high school, we're told, "all the students who remain in the top math track, who take AP BC calc, receive 5s." As a parent, I feel that this means that they are too restrictive in placement, and encourage too many children to drop out of the most demanding track. 3 is passing. Our society does not need to save tuition for 6% of the graduating class. Our society needs as many children as possible to take challenging math classes.

I took AP BC calc in my day, and received a 5. Frankly, it's not that challenging a course. More than 6% of the school population should be prepared to take the test. If the top 20% were encouraged to remain on track for BC Calc, or even the top 15%, I'd find it much more equitable.

I do feel the pressure of, "your kid's not that special, you know," in the insistence that the academic load is challenging, while seeing how restrictive placement is.
Same here.

Attewell's study (pdf file) is a revelation:
The odds of a student in an affluent star public school taking AP math or AP science are 71 -76 percent of the odds of a student of the same demographics and SAT who attends a nonstar public school.

The Winner-Take-All High School: Organizational Adaptations to Educational
Stratification
by Paul Attewell
p. 286

That's what we pay the big bucks for.

Tuesday, January 27, 2009

Jeanne Chall on decline at the top

The 1970s and 1980s brought additional reasons for discontent. The first was the continuing decline of scores on the Scholastic Achievement Tests (SATs), the decline having begun even as early as the 1960s. Another cause for growing concern was the low achievement particularly among poor and minority children on the National Assessment of Educational Progress [NAEP]. Since 1969, NAEP (also known as "The Nation's Report Card") has conducted periodic assessment of the academic performances of fourth, eighth, and twelfth graders in a range of subjects. At first it was thought that the SAT score decline resulted from growing number of low-income students taking the SAT for the first time. Later, it was found that the absolute decline in scores was even greater among the most able students (Chall, 1989). After years of debate as to whether SAT scores had significantly declined, the College Board changed its standards (permitting a "pass" with lower scores.)

Recommendations to improve educational achievement varied widely. Some championed a stronger focus on open education--calling for greater emphasis on student motivation and interest--while others called for more instruction-centered solutinos--higher educational standards and greater rigor. The most influential of the many proposals at the time was A Nation at Risk, the Report of the National Commission on Excellence in Education (NCEE, 1983). Its proposed solution was largely teacher-cntered: a more rigorous curriculum, reintroduction of traditional courses of study, and more-difficult, challenging textbooks.

Other proposals for teacher-centered solutions appeared during the late 1980s and early 1990s. In a series of studies that compared achievement in public schools with that in private and parocial schools, Coleman and Hoffer (1987) found that students in private and parochial schools tested higher on academic ahievement than those in public schools. The investigators attributed the differences to the heavier focus of the private and parochial schools on teacher-centered practices such as the use of discipline and assigning homework and grades.

The Academic Achievement Challenge: What Really Works in the Classroom
by Jeanne S. Chall
p. 41-42

in a nutshell:
  • Jeanne Chall's 1989 study of the 16-year decline in SAT scores (1964-1980) found the largest decline in scores amongst the top students
  • A Nation at Risk recommended teacher-centered classrooms and the "reintroduction of traditional courses of study"
  • Coleman and Hoffer found that classroom discipline and teacher-centered instruction were the reasons why private & parochial school students did better than students in public schools

Until tonight, I hadn't made the connection between classroom discipline and direct instruction.

Of course, it's obvious that if you're in favor of the latter, you're in favor of the former. You have to be; you can't do direct instruction without classroom discipline.

But it hadn't occurred to me that if you're opposed to "drill and kill" you might also be ambivalent about teachers maintaining law and order inside the classroom.

Saturday, September 13, 2008

nominally high performing, part 3


I still haven't gotten around to posting excerpts from Richard Elmore's article on nominally high performing schools. I will, soon. 

A nominally high performing school is a school that looks good on paper thanks to high-SES students. But when you take value added measurements, you find that while the students are high performing, the school is not. Instead, it falls into a category William Sanders, inventor of value added measurement for schools, calls slide and glide:  
I've caught the most political heat from some of the schools in affluent areas, where we've exposed what I call "slide and glide." One of the top-dollar districts in the state had always bragged about its test scores, but our measurements showed that their average second-grader was in the 72nd percentile. By the time those children were sixth-graders, they were in the 44th percentile. Under our value-added scheme, the district was profiled in the bottom 10 percent of districts in state. 
Helping Teachers Raise Achievement: an interview with William Sanders 

Here is Ted Hershberg on nominally high performing schools:
The problems with AYP ["adequate yearly progress," the NCLB measurement of school quality] are clearly evident in ... schools whose students are meeting their AYP goals, but where little growth is occurring. Most often found in affluent communities where high-test scores go hand-in-hand with family income, these schools can be referred to as "slide and glide" because they appear to be resting on the laurels of their students. It is important to understand that NCLB does nothing to hold these schools accountable for providing their students with the annual growth to which they are entitled. In a global economy characterized by fierce competition for demanding jobs that pay high salaries and benefits, this is a highly significant shortcoming. 

"Value-added Assessment and Systemic Reform: A Response to America's Human Capital Development Challenge"
Ted Hershberg
Professor, Public Policy and History
Executive Director, Operations Public Education
University of Pennsylvania

In the past week the Times has carried two stories on P.S. 8, a "hot" school in Brooklyn that has just received a grade of "F" on its NYC report card. Interestingly, while the first story, starting with the title (In Brooklyn, Low Grades for a School of Successes), falls squarely within the tests don't measure quality genre, the second is the single hardest-hitting news story about an affluent and popular school I have ever seen, certainly in the New York Times.

From the first article: 
A respected Brooklyn Heights elementary school so popular in its gentrifying neighborhood that it has doubled enrollment since 2002 is set to get an F in the second year of the Bloomberg administration's heavily contested system of grading individual schools, renewing questions about the methodology behind the grades.

Mind you, that is the lede. The point of this story is not that P.S. 8's grade of "F" renews or perhaps raises questions about the quality of the school. 

No. 

P.S. 8's "F" can only renew and/or raise questions about the quality of the grading. Which was already questionable. 
The school, Public School 8, was once avoided by the well-off residents of neighboring brownstones but has been the paragon of a turnaround tale in recent years, leading Mayor Michael R. Bloomberg to declare in 2006 that if the rest of New York’s schools made similar strides, “the future of this city would be assured.”

This year, at a July 29 news conference announcing plans for an annex to accommodate the flood of students wanting to attend P.S. 8, a parade of public officials praised the school and its principal.

Schools Chancellor Joel I. Klein said, “You have built a very successful school here,” and Deputy Mayor Dennis M. Walcott added, “You have done a monumental job in both recruiting as well as maintaining a school where parents want to send their children.”
then comes the piling on:
When the first round of report cards was unveiled last fall, there were some counterintuitive results and many complaints, but now, P.S. 8 could be the most highly regarded and popular school to receive an F.

Last school year, 67 percent of its students passed standardized tests in English and 83 percent in math, and many who know the school said such a grade would be misleading and preposterous.

“It’s a real indictment of the grading system if it takes a school that is improving rapidly and is already doing pretty well and brands it with an F,” said City Councilman David Yassky, whose district includes P.S. 8.
from there the story moves into a terrific section on the tests and how they work: 
In New York City’s formula, the largest factor in determining a school’s grade, 60 percent (up from 55 percent last year), is based on how, say, this year’s fourth graders did compared to their third-grade scores, an analysis known as a “growth model.” Student performance — median scores and how many passed the test — counts for 25 percent, but is calculated not in absolute terms but by judging each school against schools citywide as well as against 40 other schools with similar demographics. In addition, 5 percent is based on attendance, and 10 percent on the surveys.

the principal speaks:
Last year, P.S. 8 received a C — which Mr. Phillips, the principal, described as disappointing in a letter to parents that took issue with the grading system and schools that emphasize test-taking over enrichment activities.

“It is my professional and personal opinion that this grade does not reflect our school and the work we do,” wrote Mr. Phillips, 45. “This grade will give us food for thought, but it will not change the way we move forward into the future or alter our core values.”

note: the principal is a graduate of "a prestigious fellowship program ... for outstanding principals at Columbia University’s Teachers College." 


the co-president of the PTSA weighs in:
Several P.S. 8 parents suggested that the F said more about the grading system than the school. They cited events like the annual read-a-thon fund-raiser, an art program that culminated in student work’s being showcased at the Guggenheim, and the school’s recent selection as Brooklyn’s Rising Star Public Elementary School for 2008 by Manhattan Media, a publisher of weekly newspapers.

“To me this kind of grading system seems inadequate to express the education that’s occurring within an entire school, and in fact becomes quite detrimental to the education process,” said Joanne Singleton, co-president of the Parent Teacher Association.

“When you walk into P.S. 8, the children are smiling, they are happy to be there,” she added. “They are comfortable in the school environment, they are comfortable interacting with their faculty, and it is truly a community of learning.”

If you were wondering why parents don't have a union, which you probably were not, this is it. 

So that was Thursday. 

Today's article appears to have been ghostwritten by Andrew Wolf:
How could a red-hot school in Brooklyn Heights — with surging enrollment from middle-class and wealthy families, with test scores that are above average, and with extras paid for by parents’ fund-raisers — be declared a failure?

For some people, news that Public School 8 on Hicks Street will be getting an F on its upcoming report card cinches the case that education officials have lost their test-taking marbles.

And yet there is a strong argument that the F grade is just the sort of blunt truth-telling needed for schools that are highly regarded in the vaporous, unchallenged esteem of conventional wisdom.

More than 80 percent of the kids at P.S. 8 passed a standardized math test. Two-thirds passed the language arts test. In 2006, the mayor said the school should be imitated. In July, the schools chancellor announced that an annex would be built to accommodate the demand in what he said was a “very successful school.”

In reality, children who start the year at P.S. 8 with decent or good scores in math and English actually have gone backward, said James S. Liebman, the chief accountability officer for the city’s Department of Education.

“You drop them off at the beginning of the year, and on average, by the end of the year, your child lost ground in proficiency,” Mr. Liebman said.

Children on the lower end of the scale — the ones who had the most room for improvement — made only the slightest gains compared with those at similar schools, Mr. Liebman said, while at most schools across the city, there were big improvements.

“Where was the child last year, and where is the child this year?” he asked. “You’re comparing them to themselves.”

For many people, the F grade for P.S. 8 ratifies their skepticism about standardized tests. If all the children, like those in Lake Wobegon, are above average, how could the school be failing?

decline at the top
“If you use high-stakes tests and nothing else, you’re measuring ZIP code, race, socioeconomic status,” Mr. Liebman said. “Most importantly, you need to measure how much kids improve after a year at their school.”
[snip]

On average, Mr. Liebman said, the higher-performing students at P.S. 8 lost a little more than one-tenth of 1 percent in proficiency in English and math; the lower performing students gained about a tenth of a percent. Why should anyone care about such numbers?

They make a major difference by the time the students are 18, Mr. Liebman said. Students get scores between 1 and 4. Of those who finish eighth grade with a 3.0 proficiency in math and English, just 55 percent graduate from high school four years later. For those with 3.5 scores, the graduation rate is 75 percent.

“I know it’s troubling to people in the neighborhood, and it should be troubling,” he said of the F grade. “The point is, compared to any other school in the city, this school is off the charts on the low end.

“We’re trying to move away from a school that gets by on its reputation.”

At P.S. 8, Image Didn't Match Performance
Jim Dwyer

This is amazing. I have no idea -- no guess, even -- how such a turnaround could have occurred. 

For the time being I'm going to assume that I need to be reading anything and everything Jim Dwyer writes. 


bonus points:

The kids at the top are showing the least progress. Perhaps enrichment isn't the best education to offer kids who are already being enriched at home? Which is not to say that I would wish the JASON Project on disadvantaged kids, either. 

Interesting that the principal was ordered not to speak until the scores were "officially released."

The 2nd story is not accompanied by a photograph of students sitting on the floor with nary a book, pencil, or desk in view.

I believe this is the first time I've seen a newspaper or magazine allow a testing expert to make the point that education is cumulative. Over time a small loss here, a missed opportunity there, the kind of thing routinely shrugged off by administrators in wealthy schools, add up. It's the miracle of compound interest in reverse. 

The author of the first story appears not to grasp the concept of value added: 
Also contributing to the F grade was P.S. 8’s rapid change in population. A quarter of the students now qualify for free lunch, compared with 98 percent in 2002, and more than half the students are white or Asian-American, up from 11 percent in 2002. Most of these changes are happening among the youngest children, before tests begin in the third grade.
Eighty-nine percent of last year’s prekindergarteners at P.S. 8 were white, for example, as were 60 percent of kindergarteners, 49 percent of first graders and 54 percent of second graders. The test-taking grades — 3, 4 and 5 — were 27 percent, 31 percent and 19 percent white, respectively. Throughout the country, there is an achievement gap between black and Hispanic students and their white and Asian counterparts.
As the demographics changed, test scores shot up, but most of the change came between 2002, when 32 percent of the students met state standards in English and 26 percent in math, and 2005. For the last three years, scores have improved more slowly, with about two-thirds passing in English, and 71 percent, 81 percent and 83 percent in math.

She seems here to be assuming that the rapid increase in test scores caused by an influx of high-SES students is the basis on which the school was graded in the past, or would have been. 

It is not.


Friday, July 4, 2008

stagnation at the top, part 2

Here’s a simple principle: at the least, schools should be expected to help all students make a year’s worth of progress over the course of a year—even students that start school in September two or three grade levels above. And we should reserve our greatest praise (and perhaps rewards) for schools that accelerate the progress of all of their students and help each one reach his or her full potential. And that principle should apply to all of our children, regardless of the color of their skin, the size of their parents’ pocketbook, or their zip code. Anything else strikes me as unfair, unkind—and politically unsustainable.

Are public schools for all kids, or just some kids?


and, from the Heartland Institute:

Clowes: Is there any reason why students in schools with high concentrations of poverty should learn any less than students in an affluent district?

Sanders: Interestingly, I've caught the most political heat from some of the schools in affluent areas, where we've exposed what I call "slide and glide." One of the top-dollar districts in the state had always bragged about its test scores, but our measurements showed that their average second-grader was in the 72nd percentile. By the time those children were sixth-graders, they were in the 44th percentile. Under our value-added scheme, the district was profiled in the bottom 10 percent of districts in state. They were not happy. You'd think I had nuked the place.

With our value-added approach, we can demonstrate that our measure of school effectiveness is totally unrelated to traditional socioeconomic indicators. We have more than 1,300 elementary schools in this state; their effectiveness is totally unrelated to the racial composition of the school or the percentage of children in the federal free and reduced-price lunch program. That's looking at measures of progress, not at raw test scores.

You shouldn't hold teachers and principals of school districts accountable for things over which they have no control. You should hold them accountable for those things they do have control over. Schools and teachers don't have control over the achievement level when children walk in the door, but they do have control over how much that level is raised during the year.

If that is sustained over time, it becomes like compound interest, and what you see is populations of children constantly rising to higher and higher levels of achievement in later grades, regardless of where they started.

interview with William Sanders

Thursday, June 19, 2008

stagnation at the top

Fordham's report on "High-Achieving Students in the Era of NCLB" is out. I've read only 10 pages or so, but it's tremendously interesting: interesting and suggestive. (report here - pdf file)

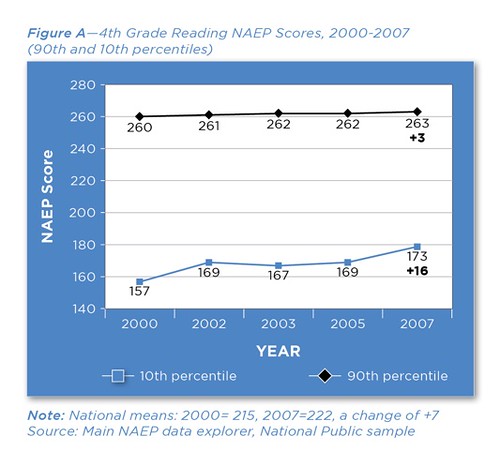
The report doesn't establish causality (and doesn't claim to), but the authors clearly think that NCLB and the standards movement in general is working: working in the sense that the bottom 10% on NAEP are steadily improving their achievement:


This is the first time I've seen the idea that NCLB is working supported by data.

It's also the first time I've heard that it's the bottom scorers, not the "bubble children" who are benefiting from NCLB.

A couple of things for now.

The report doesn't seem to mention the 1995 recentering of SAT scores or the fact that the decline in SAT scores was concentrated at the top. The report practically invites readers to shrug off the "needs" of the top 10% -- if they're already on top, how can they go higher?

Beyond this, I'm somewhat disturbed by the universal acceptance of the idea that "excellence" and "equity" are two separate things. Apparently the policy world is prepared to recognize only two conceivable positions:

  • you can have equity or you can have excellence, but you can't have "both"
  • you can have equity and you can have excellence; you can have "both"

The possibility that equity and excellence are flip sides of a coin isn't on the menu.

What I've seen, time and again, that if a school isn't doing a good job teaching the bottom 10%, it isn't doing a good job teaching the top 10%, either. It may look like it's doing a good job. But once you factor out the parent reteaching & the tutors, you see that ineffective teaching is ineffective teaching. Period.

I had started to wonder about this in terms of athletic programs. Often people think of athletics and academics as either/or -- and when you're talking about athletics and academics at the highest level of individual achievement, of course they are either/or.

But when you're looking at a school, what goes with what?

Good academics with poor athletics?

Good athletics with poor academics?

I'm coming to the conclusion that's not the case.

No time to give my various "data points" at the moment, so I'll content myself with just one.

Two weeks ago I attended the Sports Orientation Night at C's new school. The place was mobbed. The principal spoke first. Toward the end of this talk he said that 10 or 12 years ago, the school had decided to raise its admission standards. The one thing he regretted at the time, he told his wife, was that the school had always been known for its strong athletic programs. Once they started admitting more academically oriented kids with higher scores, their win-loss records would suffer.

But that's not what happened. Instead, the wins show up; in one year alone the school won 3 more citywide championships than they had in the preceding 7 years. The principal and the athletic director both said they still don't understand why that happened.

To me, it made sense. I'd been noticing that great high schools, academically speaking, tend to have great teams.

A school that's on the march is on the march. They're not on the march here, but phoning it in there. When you're on a mission, you're on a mission.

I understand that trade-offs exist, opportunity costs are real, etc. But I don't think "trade-offs" and "opportunity costs" capture the way a high-performing organization functions.

In fact, I'm sure of it.

Back later.

Saturday, May 31, 2008

Race Between Education and Technology

The book is out. These are major academics, fyi.

Excerpt here. (pdf file)


blurb:
Table of Contents

Part I: Economic Growth and Distribution
1. The Human Capital Century
2. Inequality across the Twentieth Century
3. Skill-biased Technological Change

Part II: Education for the Masses in Three Transformations
4. The Origins of the Virtues
5. Economic Foundations of the High School Movement
6. America's Graduation from High School
7. Mass Higher Education in the Twentieth Century

Part III. The Race
8. The Race between Education and Technology
9. How America Once Led and Can Win the Race for Tomorrow

related: public confidence in the schools
In the early 1970s, not only did most Americans believe that the public schools were functioning reasonably well, a sizable majority of adults thought that public education had actually improved since they were kids. Today, only a small minority of Americans share this optimistic view. Instead, the majority now believes that schools have gotten significantly worse. Fully half of all Americans are dissatisfied with America’s public education system, a deep concern shared by black and white parents alike.

The Two-Income Trap: Why Middle Class Mothers and Fathers Are Going Broke
by Elizabeth Warren & Amelia Warren Tyagi


It looks to me as if public confidence in the schools declined at the same time Goldin and Katz find public education no longer keeping pace with developing technology -- and no longer serving to decrease inequality.


Steve Levitt summarizes The Race in 2 sentences
Jimmy graduates

The anemic response of skill investment to skill premium growth
The declining American high school graduation rate: Evidence, sources, and consequences
Pushy parents raise more successful kids

The Race Between Education and Technology book review
The Race Between Ed & Tech: excerpt & TOC & SAT scores & public loss of confidence in the schools
The Race Between Ed & Tech: the Great Compression
the Great Compression, part 2
ED in '08: America's schools
comments on Knowledge Schools
the future
the stick kids from mud island
educated workers and technology diffusion
declining value of college degree
Goldin, Katz and fans
best article thus far: Chronicle of Higher Education on The Race
Tyler Cowan on The Race (NY Times)
happiness inequality down...
an example of lagging technology diffusion in the U.S.

the Times reviews The Race, finally
IQ, college, and 2008 election
Bloomington High School & "path dependency"
the election debate that should have been

Friday, May 23, 2008

Independent George on "the naturals"

re: Allison on "the naturals"

I am a sample size of one, but this matches my experiences. I am one of those 'naturals' who got to college, and realized I had three choices:

1. Study twice as hard to become a median student in chemistry
2. Study twice as hard to become a top student in economics.
3. Keep my same work habits to stay a median student in economics.

Shamefully, I chose option number 3 (and am now paying for it by working four times as hard to become a top student in an MS program I probably wouldn't have entered if I'd wised up earlier).

The other point is all those pesky foreigners are now entering the easy subjects like economics and biology.

the one that got away

Major find.

A 1991 Atlantic Monthly article on The Other Crisis in American Education.


the 16-year decline and the 1995 "recentering"

By way of background: SAT scores declined from 1964 to 1980. Math scores rose most of the way back up to where they'd been but verbal scores did not, and in 1995 the College Board recentered the scores.

My district's scores, which are significantly higher than those for other schools in our demographic, assuming I've read the charts correctly (chart correlating income and scores here; chart for determining significance here) are:

V-540 M-568 W-540 total: 1648

Prior to 1995 those scores would have been:

V-460 M-560

1108 today; 1020 before 1995. Big difference.


decline at the top

Over the years I've seen various rebuttals of the claim that the decline was due to an expansion of the pool of test takers. See here and here.

What I had not seen was the data showing that the decline was concentrated at the top:

[N]orm-referenced tests .... were able to tell us not just about the existence of the decline but something about its magnitude--half a standard deviation on the SAT--and something about its source--the decline on all norm-referenced tests was much greater among students at the top of the score distribution than among those at the bottom.

The decline at the top was so steep that the absolute number of students scoring over 650 on the verbal half of the SAT declined 45 percent between 1972 and 1982. That means the pool of top talent available for scholarship and research, for business and industry, and for the military has actually shrunk. We need to enlarge it again as quickly as we can by encouraging excellence in our schools, and we need tests that will let us gauge our progress at that vital task. The best-calibrated gauge for these purposes is a norm-referenced test. That is why a national census of educational quality should include not just a test of V and M, but a norm-referenced test of those essential, all-purpose abilities.
p. 49

[snip]

The importance of these periodic checks on test constancy is well illustrated by data on the SAT. They show that efforts to hold the difficulty level of the test constant over the years were quite successful from 1941 to 1963; less so from 1963 to 1973, when some downward drift occurred, making it a bit easier to get higher scores after 1963 than before.[23] The SAT was also easier to read in the 1960s and the 1970s than it was in the 1940s and the 1950s; the difficulty level of reading passages on the test declined, as measured by the Dale-Chall formula, from a corrected grade level of 13 to 15 to only 11 to 12.24

All in all, SAT scores in recent decades probably underestimate the great American score decline by about 8 to 12 points, roughly one-tenth of a standard deviation.

source:
A National Census of Educational Quality—What Is Needed by Barbara Lerner NASSP Bulletin / March 1987 p. 56


the one that got away

While the rest of the country was falling apart, SAT-wise, some schools sailed through those years unscathed. Daniel Singal's 1991 article summarizes a study of the ones that got away:

What has caused this great decline in our schools? The multitude of reports that now fill the library shelves tend to designate “social factors” as the prime culprit. Television usually heads the list, followed by rock music, the influence of adolescent peer groups, the increase in both single-parent families and households where both parents work, and even faulty nutrition.
Those who attribute the loss of academic performance to social factors don't take account of the small number of high schools around the country that have managed to escape the downturn. Some are posh private academies; a few are located in blue-collar neighborhoods. What they have in common is a pattern of stable or even rising test scores at a time when virtually all the schools around them experienced sharp declines. There is no indication that the children attending these exceptional schools watched significantly fewer hours of television, listened to less heavy-metal music, were less likely to have working mothers, or ate fewer Big Macs than other children. Rather, they appear to have had the good fortune to go to schools that were intent on steering a steady course in a time of rapid change, thus countering the potentially negative impact of various social factors.

It would seem obvious good sense to look closely at this select group of schools to determine what they have been doing right, but as far as I can determine this has been done in only two national studies. The better one was issued by the National Association of Secondary School Principals (NASSP) in 1978, under the somewhat pedestrian title Guidelines for Improving SAT Scores. Now out of print and hard to find, it contains one of the most perceptive diagnoses available of the underlying malady in our schools.

[snip]

The report identifies one main characteristic that successful schools have shared—the belief that academics must invariably receive priority over every other activity. “The difference comes,” we are told, “from a singular commitment to academic achievement for the college-bound student.” These schools did not ignore the other dimensions of student life. By and large, the NASSP found, schools that maintained excellence in academics sought to be excellent in everything else they did, they “proved to be apt jugglers, keeping all important balls in the air.” But academic work came first.

Two other factors help account for the prowess of these schools in holding the line against deterioration. The first is a dogged reliance on a traditional liberal-arts curriculum. In an era of mini-courses and electives, the tiny group of high schools that kept test scores and achievement high continued to require year-long courses in literature and to encourage enrollment in rigorous math classes, including geometry and advanced algebra. Though the learning environment in those schools was often “broad and imaginative,” in the words of the NASSP, fundamentals such as English grammar and vocabulary received heavy stress. The other key factor in preserving academic quality was the practice of grouping students by ability in as many subjects as possible. The contrast was stark: schools that had “severely declining test scores” had “moved determinedly toward heterogeneous grouping” (that is, mixed students of differing ability levels in the same classes), while the “schools who have maintained good SAT scores” tended “to prefer homogeneous grouping.”

If attaining educational excellence is this simple, why have these high-quality schools become so rare? The answer lies in the cultural ferment of the 1960s.

So there you have it.

The hardy little band of schools where student achievement did not decline shared three characteristics:
  • academics first and foremost, with a commitment to excellence in all endeavors
  • “dogged reliance on a traditional liberal-arts curriculum”
  • homogeneous grouping; schools with heterogeneous grouping had “severely declining scores”

My own district is doggedly moving in exactly the opposite direction. Character education and the whole child over academics, the fragmenting and blurring of the curriculum via "Exploratory" courses and interdisciplinary teaming thanks to the middle school model, and an "identified need" for "balanced classes." Balanced classes being the new term of art for heterogeneous grouping in these parts.

Oh, and more more technology.

Most school districts are headed in this direction, and the kids at the top will be hurt.

I think kids at all levels will be hurt, but if I had to guess I'd say the kids at the top and at the bottom will be worst off. More on them anon.

Nobody cares. The kids at the top are assumed to be bulletproof; as our middle school principal told a well-attended school board meeting, "I'm not concerned about the kids at the top."

The kids at the bottom can flounder and sink until they qualify for special ed. Then they'll get some "pull-out."


stagnation at the top - Fordham report
Tracking: Can It Benefit Low Achieving Children?
Linda Valli on tracking in 5 Catholic high schools, 1
Linda Valli on tracking in 5 Catholic high schools, 2
"school commitment" in Valli's study of tracking in Catholic high schools

7th grade depression starts in 1st grade

ability grouping in Singapore
characteristics of schools where SAT scores did not decline
The Other Crisis in American Education by Daniel Singal
Hiding in Plain Sight: grouping & the achievement gap
tracking: first random-assignment study

SAT equivalence tables
SAT I Individual Score Equivalents
SAT I Mean Score Equivalents

chickens have come home to roost
the deathless meme of the high performing school
Allison on the naturals

Friday, May 2, 2008

Allison on "the naturals"

The "naturals" will be fine, I think. Kids with natural math talent can come from behind. I could be too sanguine about this, of course...
You are. The kids with natural math talent who are not utter prodigies DO NOT come from behind at a school like Harvard, MIT, Caltech in the math or sciences. They are completely outclassed by the Russians, Czechs, Estonians, Koreans, Japanese, Singaporeans, etc. In physics at MIT, the Russian kids were an order of magnitude ahead of the brightest American math kid in physics. In math, it was the same.

What American kids have going for them is an escape hatch: the "naturals" in math can more easily go into Investment Banking and other places that math skills are wanted than the foreigners, such as the Russians can, it seems (because of a lack of H1 B visas, maybe?)

But the only thing keeping more of the best math and science foreign kids out of MIT and the Ivies are restrictions on percentages of foreign students.

In grad school, it's almost a lost cause. There are virtually no Americans in the top programs, and white American men are almost unheard of. They have to have been the real prodigy (skipped high school, or college at 15, etc. and never fell off the train of perfection) to get there.